High Level Design
Observability in Distributed Systems
Logging, monitoring, anomaly detection algorithms, and root cause analysis techniques for distributed systems.
Logging#
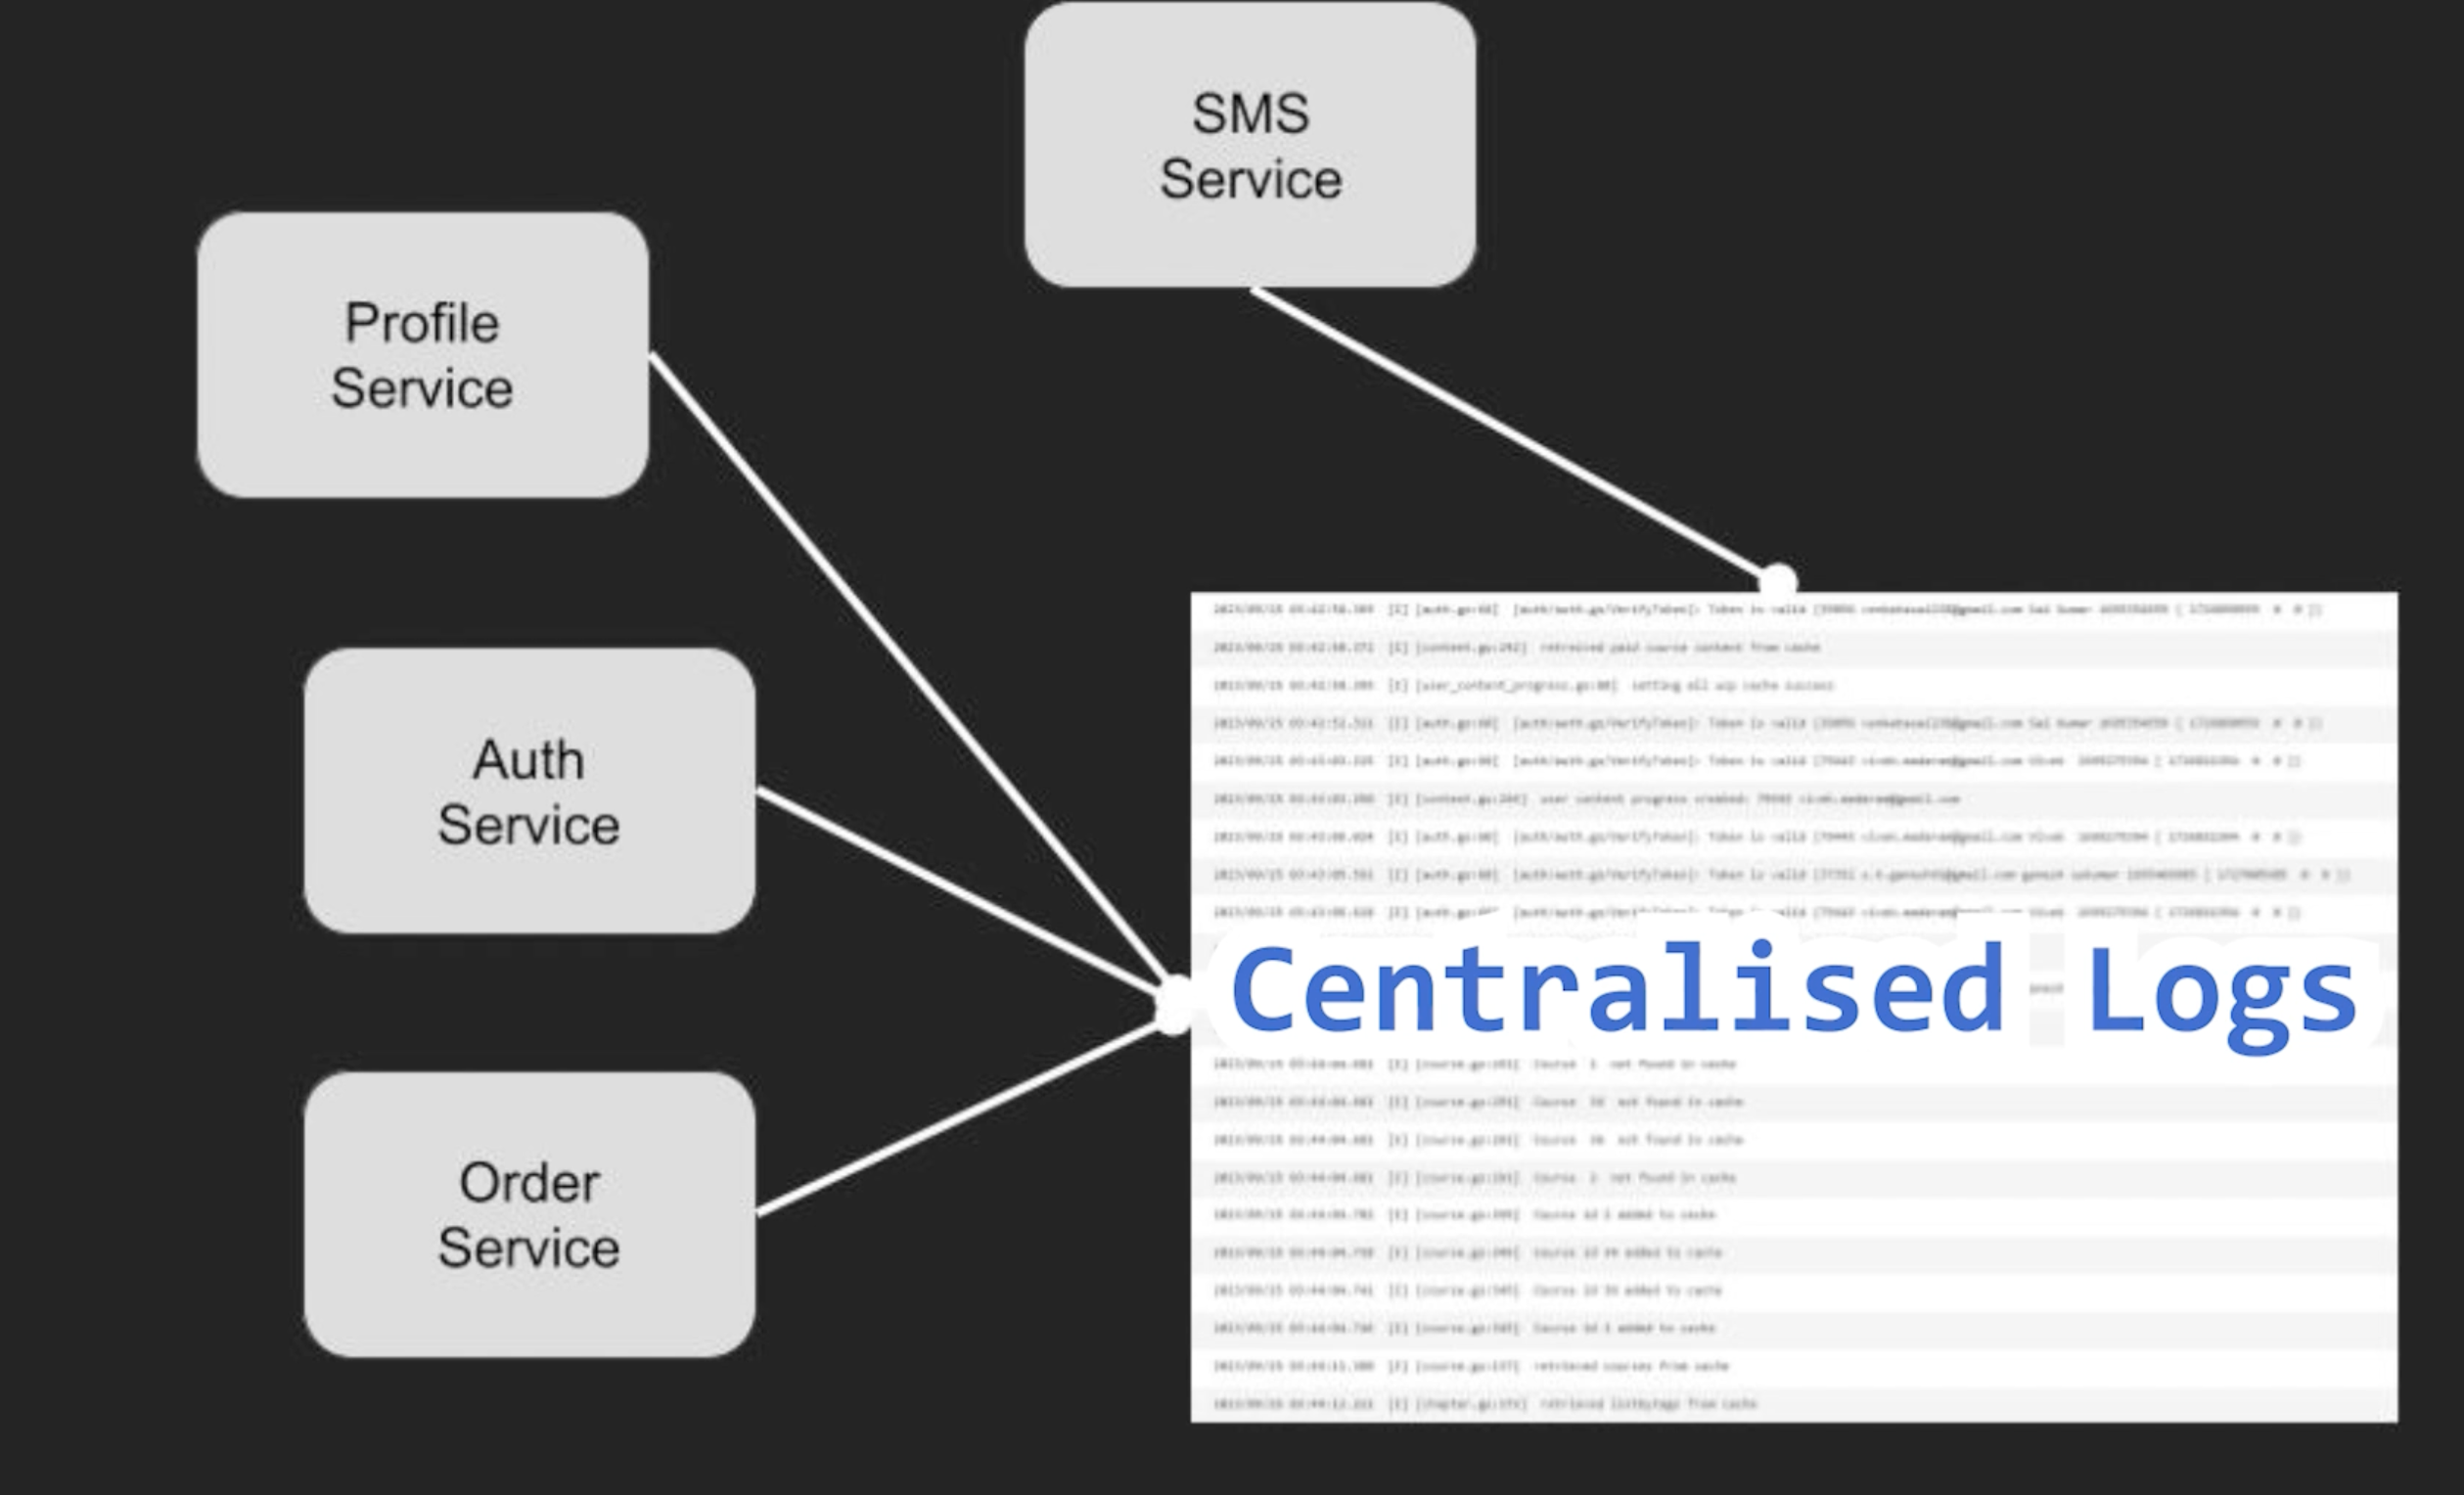
Logging tracks events and behaviors in a system — similar to print statements but structured for production.
Components of a Log Line#
| Field | Description |
|---|---|
| Timestamp | When the event occurred |
| Event Level | Severity: INFO, WARN, ERROR, DEBUG |
| Event Details | Description of what happened |
| Code Reference | File and line number where the log was generated |
Monitoring#
Monitoring tracks metrics — numerical values representing aspects of system performance — over time.
Examples of Metrics#
- Memory usage — RAM consumed
- IO operations — Number of input/output operations
- Business metrics — Sales figures, conversion rates
- User metrics — Active users, page visitors
Metrics are collected over time and displayed in graphs or time series. Dashboards give operations teams a visual overview of system health.
Operational Use#
- Enables manual decision-making (e.g., scale up load balancers when request volume spikes)
- Helps respond proactively to performance trends or anomalies
Anomaly Detection#
Quickly identify unusual patterns or deviations — unexpected spikes or drops — before they escalate.
Techniques#
Confidence Intervals
- Sets expected ranges based on historical data
- ❌ May not adapt well to seasonal or cyclic metrics
Differentiation of Metrics
- Repeated differentiation of data points reveals spikes
- ✅ Amplifies deviations over multiple iterations
Holt-Winters Algorithm
- Adjusts for both trends and seasonal variations
- ✅ Effective for metrics with inherent seasonal patterns
Root Cause Analysis (RCA)#
Understanding what went wrong when a system experiences an anomaly.
Manual Approach#
Investigation methods: analyzing log lines, metrics, and exploring potential causes
Five Whys technique: Ask "why?" iteratively to drill down to the root cause.
Example: Service is down → Why? DB is unresponsive → Why? Connection pool exhausted → Why? Spike in traffic → Why? Marketing campaign launched → Root cause: no rate limiting or auto-scaling policy for campaign traffic.
Used to build a comprehensive incident report.
Automated Approach#
Analyzes factors affecting a metric and isolates the primary contributor using mathematical algorithms:
- Principal Component Analysis (PCA)
- Spearman Coefficient
- ML-based approaches (e.g., Amazon SageMaker with isolation trees)